Fitbit Heart Rate Variability Explained: Metrics and Limits
Explore how Fitbit heart rate variability tracking works, how Google calculates readiness, and why cross-brand metrics like Apple Watch differ.
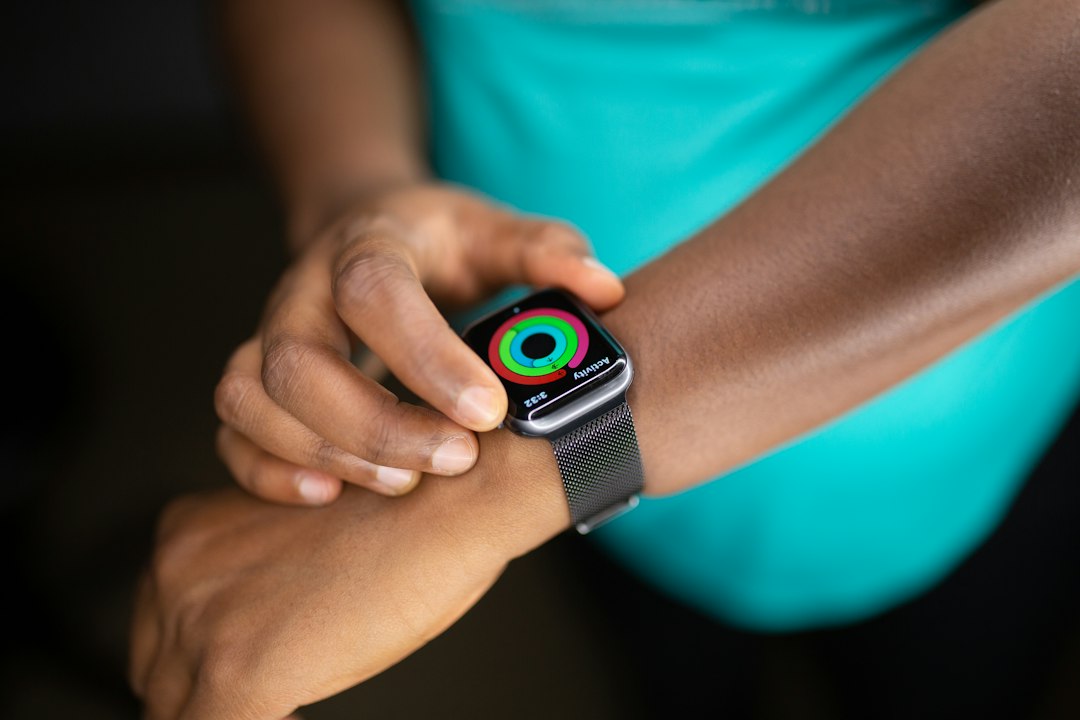
Fitbit heart rate variability monitoring offers users a window into autonomic nervous system health by recording microsecond deviations between consecutive heartbeats during sleep. Rather than aiming for a single target number, effective tracking relies on establishing an individual baseline to evaluate physical strain, recovery status, and systemic stress. Understanding these numbers requires analyzing how optical wrist hardware collects data, how mathematical algorithms process beat timing, and how platform-specific metrics differ across the consumer wearable industry.
The Physiological Mechanics of Heart Rate Variability
Heart rate variability measures the constantly fluctuating time gaps between individual heartbeats, known as interbeat intervals. While a standard pulse readout averages these beats into a single rate per minute, cardiac rhythms are inherently irregular on a millisecond scale. This variance is regulated by the autonomic nervous system, which balances the sympathetic branch—responsible for the fight-or-flight stress response—and the parasympathetic branch, which governs rest, digestion, and systemic recovery.
When parasympathetic activity dominates, beat intervals exhibit greater variability, signaling that the cardiovascular system is resilient, relaxed, and well-recovered. Conversely, heavy physical exertion, physiological illness, emotional tension, or chemical stressors like alcohol suppress parasympathetic influence, causing beat intervals to become unnaturally uniform. Because baseline readings depend heavily on age, biological sex, cardiovascular conditioning, and genetic factors, an identical millisecond reading can indicate peak athletic recovery in one person and pronounced physiological exhaustion in another.
Mathematical Divergence: RMSSD Versus SDNN
Comparing biometric outputs across different smartwatch manufacturers frequently leads to confusion because hardware platforms rely on distinct statistical algorithms to calculate heart rate variability:
- Root Mean Square of Successive Differences (RMSSD): Used predominantly by Google's Fitbit ecosystem, this mathematical formula measures high-frequency, beat-to-beat shifts over short intervals. It acts as a primary proxy for parasympathetic nerve activity and is particularly suited for overnight tracking when bodily movement is minimal.
- Standard Deviation of Normal-to-Normal Intervals (SDNN): Employed by Apple Health as its default native metric, SDNN calculates overall variance across a broader time window. This approach reflects combined inputs from both sympathetic and parasympathetic nervous systems, yielding absolute numerical values that run substantially higher than RMSSD outputs.
Because of these underlying mathematical differences, direct metric conversions between ecosystems are impossible. A user switching between device brands must build a new personal baseline within that specific software framework rather than attempting to match historical figures directly.
Sensor Mechanics and Hardware Constraints
Consumer wristbands capture cardiovascular activity using photoplethysmography (PPG). This technique projects green LED illumination through the epidermis into cutaneous microvascular beds, utilizing light-sensitive photodiodes to measure localized blood volume expansion with every pulse wave. While modern optical PPG components have improved dramatically, inherent hardware limitations separate them from clinical instruments.
Independent validation testing on consumer optical hardware demonstrates moderate-to-strong correlation with clinical-grade electrocardiogram (ECG) equipment. However, optical wrist arrays systematically tend to underestimate absolute peak variability. Because PPG relies on peripheral microvascular flow rather than direct electrical impulses from the cardiac sinus node, several physical vectors introduce noise:
- Movement Artifacts: Involuntary arm shifting or restless sleep disrupts photodiode contact, altering light absorption curves.
- Peripheral Perfusion: Cold skin temperatures constrict peripheral capillary vessels, reducing optical signal quality.
- Sensor Placement: Incorrect band tension or proximity to the wrist bone alters the path length of reflected light.
In contrast, dedicated ECG sensors measure electrical depolarization directly across heart tissue, bypassing subcutaneous optical interference entirely. While optical PPG is highly effective for tracking relative longitudinal trends over months, it lacks the absolute accuracy of clinical electrical telemetry.
How Google Integrates Biometrics into Readiness Scores
Google synthesizes raw heart rate variability data into its daily consumer readiness framework by blending three distinct biometric inputs: overnight variability baselines, resting heart rate shifts, and recent sleep architecture logs. The algorithm evaluates whether an individual's current metric falls within, above, or below their trailing historical norm.
When overnight HRV drops significantly below baseline while resting heart rate climbs, the algorithm lowers the daily readiness index. Numerical readiness outputs dropping below a threshold of 30 signal elevated systemic stress or incomplete muscular recovery. Under these conditions, the software advises users to prioritize active recovery or rest over intensive cardiovascular workouts. This algorithmic approach contextualizes raw millisecond data into practical athletic guidance, steering users away from acute overtraining.
Interpreting Trend Shifts Versus Acute Fluctuations
Isolating the root cause of an anomalous reading requires evaluating temporal patterns rather than reacting to single-day drops. Isolated downward spikes are common after intense training sessions, late-night meals, alcohol consumption, or poor sleep quality. These transient drops represent normal physiological adjustments to acute strain and typically self-correct within 24 to 48 hours.
Conversely, persistent downward trends sustained over multiple consecutive weeks signal chronic stressors. Prolonged suppression of baseline variability—especially when paired with elevated resting heart rates or disrupted sleep architecture—frequently points to systemic overtraining syndrome, high environmental stress, or onset of viral illness. Wearable devices function as early-warning indicator systems rather than diagnostic instruments; ongoing abnormal trends warrant consultation with a medical professional rather than self-diagnosis.
What to Watch in Next-Generation Biometric Wearables
As the consumer wearable industry matures, hardware vendors are moving beyond simple nocturnal PPG snapshots toward continuous multi-wavelength sensing. Future developments to monitor include:
- Multi-Channel PPG Arrays: Integration of red and infrared wavelengths alongside green LEDs to improve capillary penetration depth and eliminate motion-induced noise.
- Continuous ECG Telemetry: Micro-power sensor architectures capable of sampling intermittent electrical signals throughout the day without draining battery life.
- Standardized Health Data Protocols: Emerging software frameworks designed to translate raw RMSSD and SDNN data into unified clinical formats for electronic health record integration.
These technical advancements will narrow the performance gap between consumer health wearables and clinical diagnostics, giving users increasingly precise context for their daily physiological data.
Reporting reference: this briefing is TechWire’s independent analysis. Primary reporting was published by Engadget — read the source article.
Related analysis
x86 Processor Evolution: How Legacy Trade-Offs Won
Explore the x86 processor evolution, from 1970s hardware choices to modern computing compatibility, explaining little-endianness and register design.

NSF Leadership Nomination Collapses Amid Science Policy Crisis
Senate pushback on the NSF leadership nomination highlights growing friction over federal science funding and academic research oversight.

TRMNL Frame: Full Color ePaper Display Canvas Debuts
An analysis of TRMNL Frame, a 31.5-inch full color ePaper display using Spectra 6 tech, custom color engines, and in-house manufacturing.